
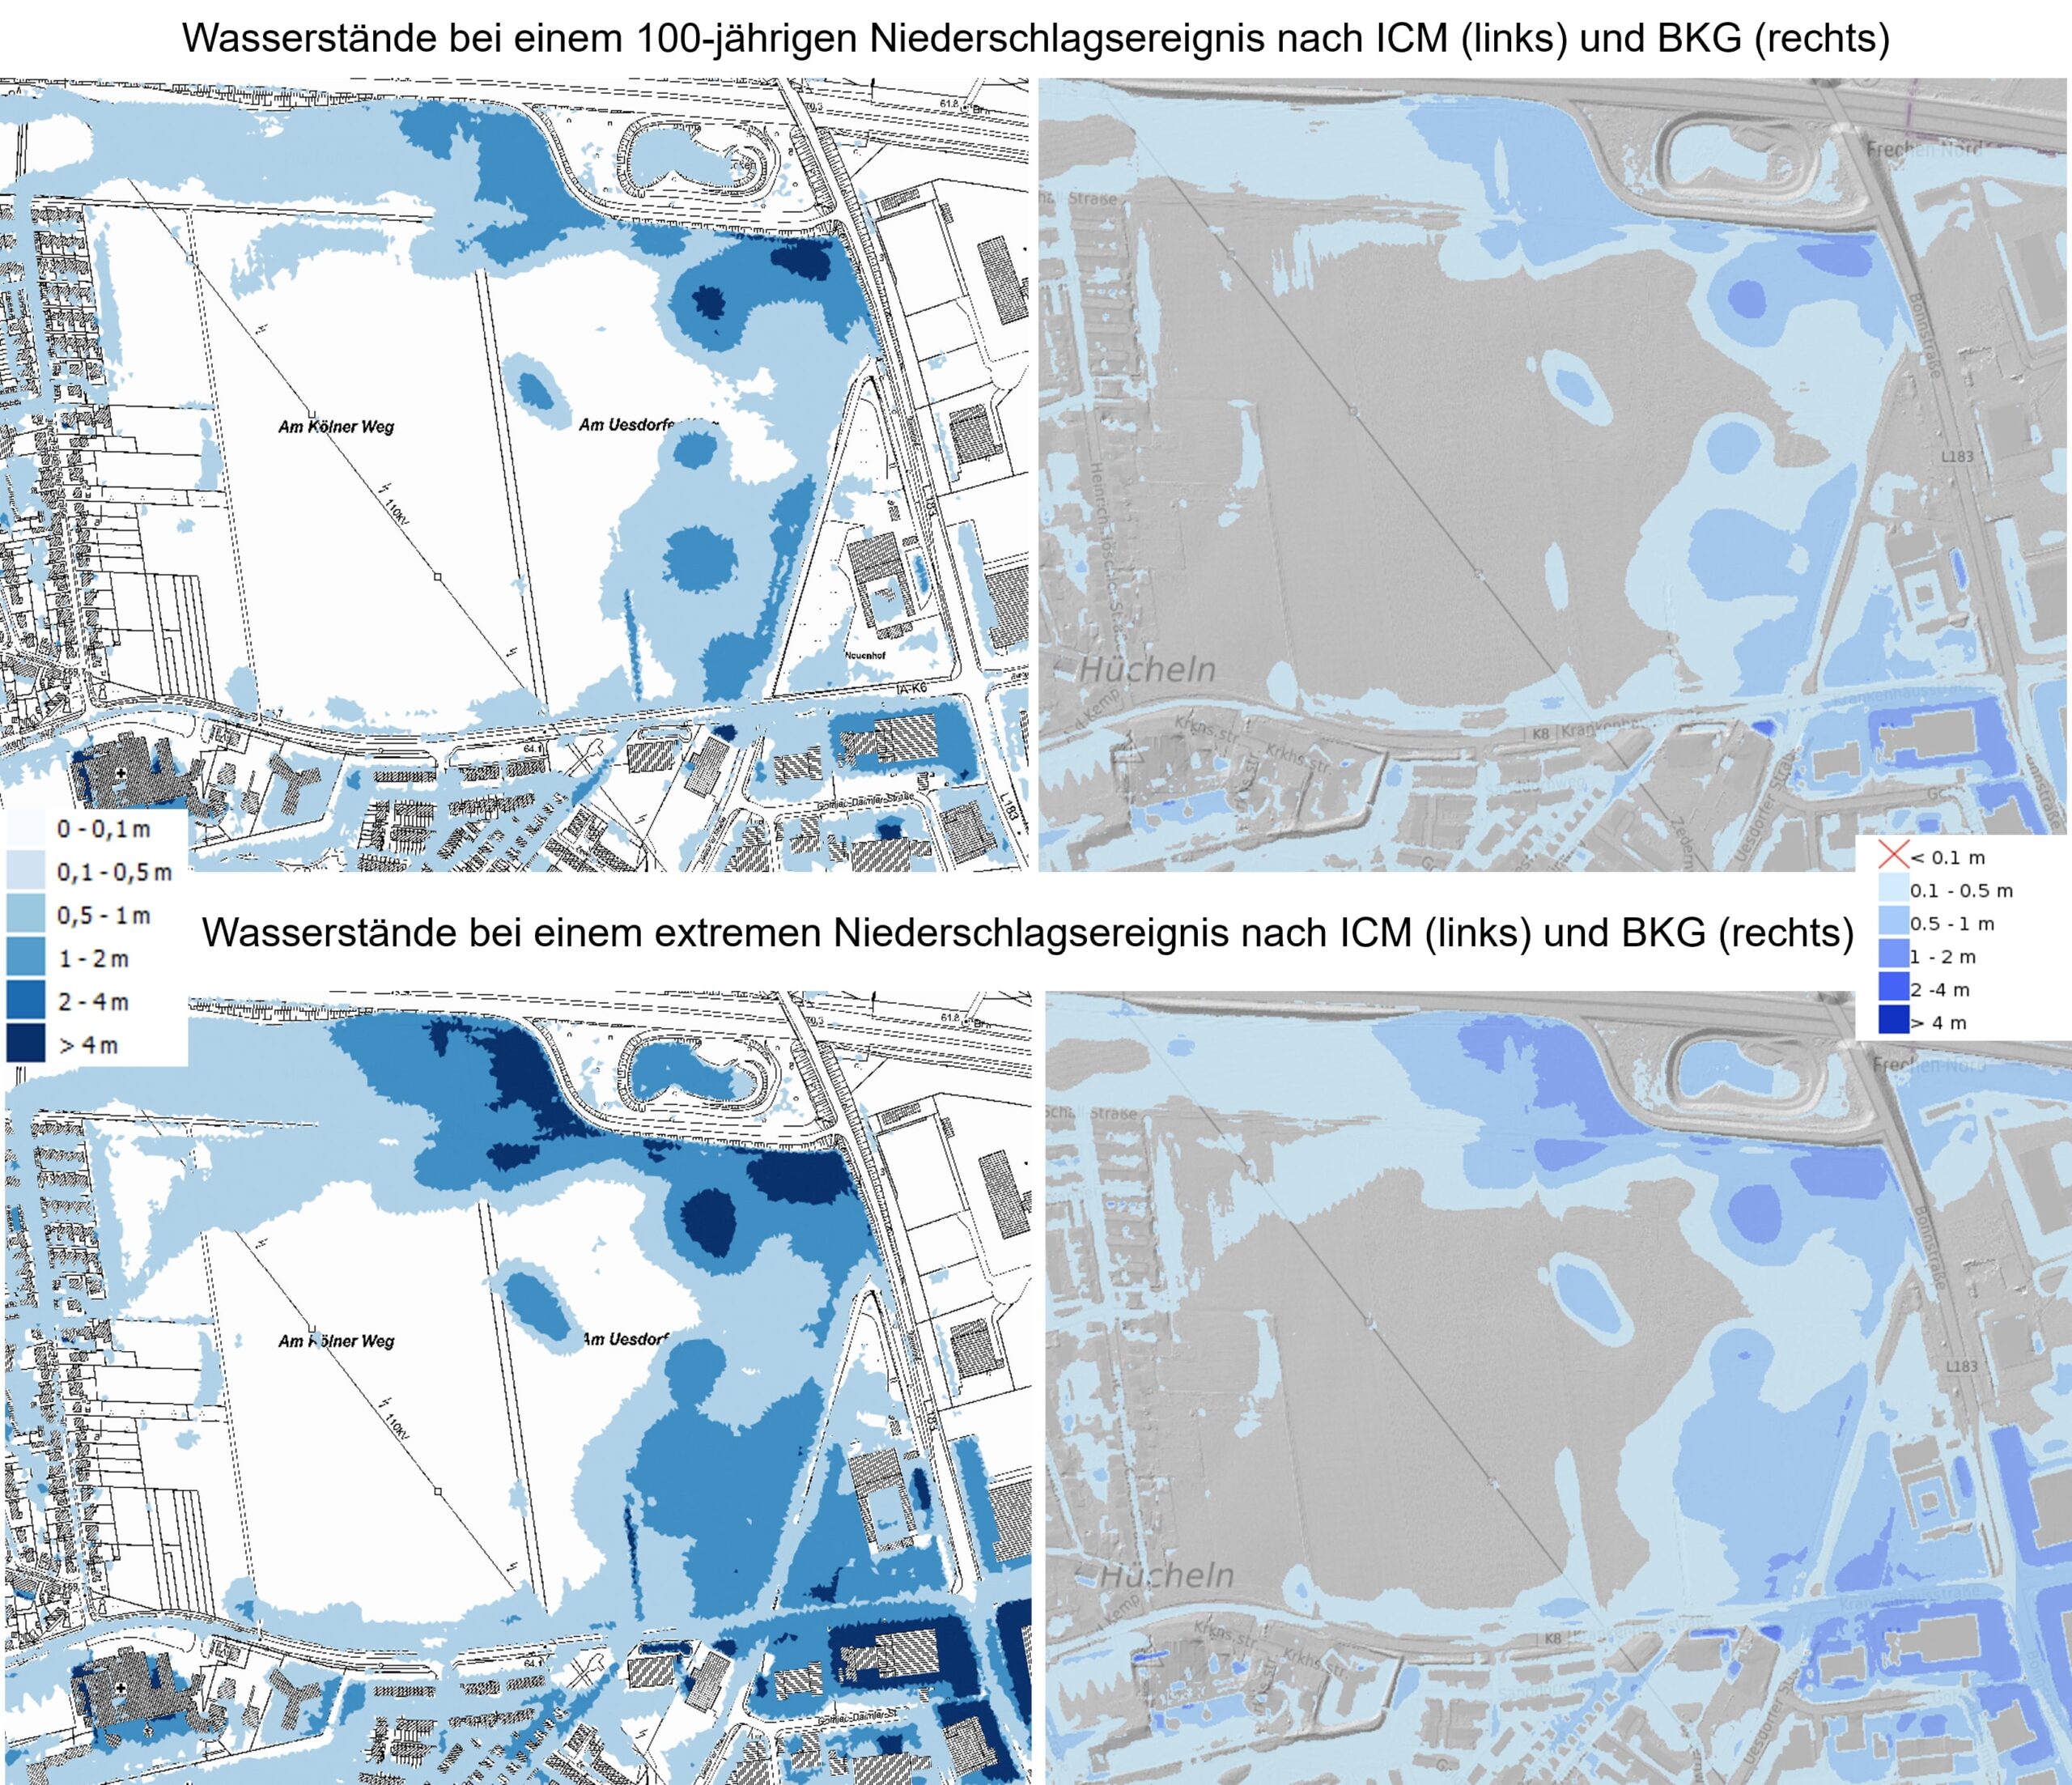
| Damage caused by locally concentrated heavy rainfall events has increased disproportionately in recent decades. One example of this is the 2021 event in Western Europe, which can be defined as a "hybrid event". Normally localised heavy rainfall caused flash floods and flooding along many larger watercourses. Above all, the development or increase in damage potential in areas at risk of flooding and heavy rainfall, especially in urban areas, can be seen as the cause. In order to improve precautions for heavy rainfall in urban areas, it is necessary that corresponding hazard and risk maps form a reliable basis for the definition and implementation of these precautionary measures. If such heavy rain hazard maps are available, especially in urban areas, they can be used as reference data to compare and check the plausibility of newly created 2D HN models. The basic data required for a flood or heavy rain hazard analysis depends on the task and the desired accuracy. In addition to this basic data, it is advisable to examine the modelled area during a site inspection for structures relevant to runoff, such as culverts, pipework, dams, embankments, ditches or paths, and to transfer these findings to the model. In addition, the 2D HN modelling is preceded by a topographical hazard analysis. Coupling 1D and 2D HN calculations is possible in programmes such as InfoWorks ICM, but is currently rarely carried out in practice due to a lack of data on the sewer network and/or excessive computational effort for large-scale model areas. In view of the advancing digitalisation and the increasing implementation of the Building Information Modelling (BIM) method, the information on water levels and flow velocities obtained from the modelling can be implemented in different specialist models. In addition, these can also be displayed in three dimensions, which is particularly helpful for the visualisation of flooding scenarios and for the derivation and justification of measures. M&P Water GmbH carries out flood hazard analyses and comparisons with heavy rain hazard maps using the InfoWorks ICM software, for example for a project in Cologne-Frechen. Here, the comparison of the ICM results with the heavy rainfall hazard maps of the Federal Agency for Cartography and Geodesy (BKG) evidently showed a very good match, which could be verified with the help of a statistical analysis of the data sets. In addition to observing the actual state of the project area, the model can also be used to model planned conditions, such as structural changes, and the results can be compared with those of the actual state and visualised using difference maps. Depending on the result, possible deteriorations in the planned state can be verified or rejected and appropriate countermeasures can be recommended and planned. Heavy rain information map of the Federal Agency for Cartography and Geodesy: https://geoportal.de/map.html?map=tk_04-starkregengefahrenhinweise-nrw |
Flood hazard analysis and comparison with heavy rain hazard maps
12
Mar